[TR] 3.6 How do you analyze a Diagnostics Report?
1. Here’s how
The Diagnostics Report is a great way to spot the following problems on a user’s computer:
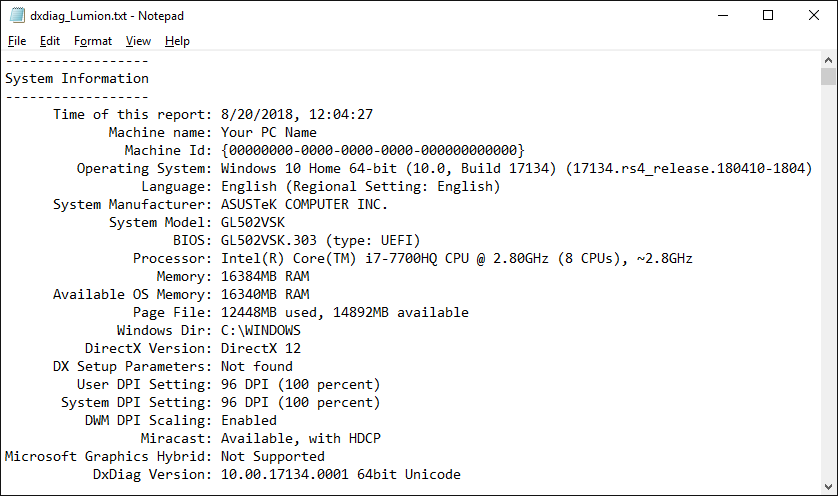
- Outdated Windows version.
- Old graphics card drivers.
- Too low display resolution (lower than 1600x1080 pixels).
- Too high monitor resolution (affects FPS performance).
- An Intel HD graphics chip is being used instead of an AMD or NVIDIA graphics card.
- Lack of free disk space.
- Lack of Virtual Memory (swap space on the hard drive).
- Lumion and other software crashes.
- Windows integrity errors (e.g. Kernel and BlueScreen events)
1.1: The following article explains how to analyze a report:
- Knowledge Base: How do you analyze a Diagnostics Report?
Lumion 11.3 and newer versions now generate three reports when the user follows the instructions in this article:
- Knowledge Base: How do you provide a diagnostics report?
They are saved in a folder named 'techsupport' located in the Lumion Documents folder.
Important: from Lumion 11.5 and onwards, the info in the techsupport folder is complete. Before (in previous versions), the WER at the bottom of the DxDiag would sometimes be truncated, but Marius added a 2 second creation delay to the file starting with the aforementioned version.
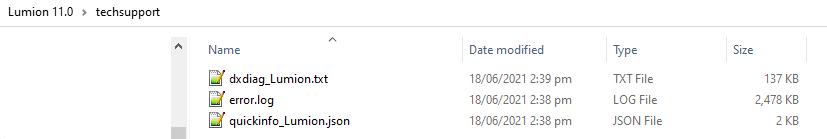
The quickinfo_Lumion.json is a summary Lumion now generates of salient diagnostics data such as the driver version, so this can be used as a quick lookup to see if the core settings of the PC are not appropriate.
The error.log file no longer needs to be asked for separately (so long as Error Logging is set to on in the Settings) and provides an important log of Lumion events:
- Knowledge Base: How do you provide a Lumion Error Log file?
The error.log file also contains some key importer data. But there is also a separate importers.log file for import-only issues when the import method is using LiveSync.
==========================================
ARTICLE SUPPORT (from transfer to HubSpot):
1. Tables:
Tables were not able to be imported via HubSpot Importer. Any Tables in this article are now based on a DIV Conversion. Same is also the case for the transfer of articles with tables in the EKB.
You can add new (basic) Tables in the HubSpot Editor directly.
If the layout does not work, then you can copy/paste or recreate the old Table from ZD. Where possible the Table has also been copy/pasted from the source page (see link below in 3.). Instructions, see this article: Copying an old Zendesk Table over to HubSpot
2. Finding the reference to the old Zendesk Ticket in HubSpot:
Use this Support article: Finding the reference to the old Zendesk Ticket in HubSpot
and for ZD ticket Search in HubSpot following step 1 in above article:
3. Source Zendesk article:
A source and backup copy was made of all articles 9 June 2025.
The saved HTML files and images are in subfolders of: HTML files and images subfolders.
See also Support article in 2 above.
Backup/copy article: [TR] 3.6 How do you an... (4402795038226).html
4: Quick Link to Zendesk IKB article:
(not available when Zendesk closed)
[TR] 3.6 How do you analyze a Diagnostics Report?